The lineplot (lmplot) is one of the most basic plots. It shows a line on a 2 dimensional plane. You can plot it with seaborn or matlotlib depending on your preference.
The examples below use seaborn to create the plots, but matplotlib to show. Seaborn by default includes all kinds of data sets, which we use to plot the data.
Practice now: Test your Python skills with interactive challenges
line plots
lmplot
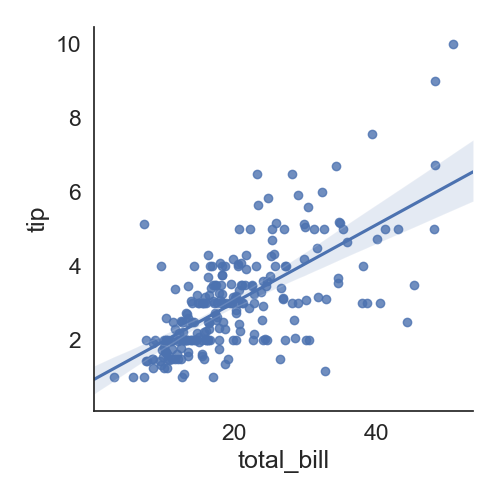
The lmplot plot shows the line along with datapoints on the 2d space. By specifying x and y you can set the horizontal and vertical labels repsectively.
import seaborn as sns
import matplotlib.pyplot as plt

data=sns.load_dataset("tips")
data.head(5)

sns.set(font_scale=1.5,style="white")
sns.lmplot(x="total_bill",y="tip",data=data)
plt.show()
line plot
The plot below shows different types of line plots. They can be any color you'd like. We use a dataset included in seaborn, but this would work with any kind of data.
import seaborn as sns
import matplotlib.pyplot as plt

sns.set(style="ticks")

# Load the example dataset for Anscombe's quartet
df = sns.load_dataset("anscombe")

# Show the results of a linear regression within each dataset
sns.lmplot(x="x", y="y", col="dataset", hue="dataset", data=df,
           col_wrap=2, ci=None, palette="muted", height=4,
           scatter_kws={"s": 50, "alpha": 1})

plt.show()

Practice now: Test your Python skills with interactive challenges