The seaborn boxplot is a very basic plot Boxplots are used to visualize distributions. Thats very useful when you want to compare data between two groups.
Sometimes a boxplot is named a box-and-whisker plot. Any box shows the quartiles of the dataset while the whiskers extend to show the rest of the distribution.
Practice now: Test your Python skills with interactive challenges
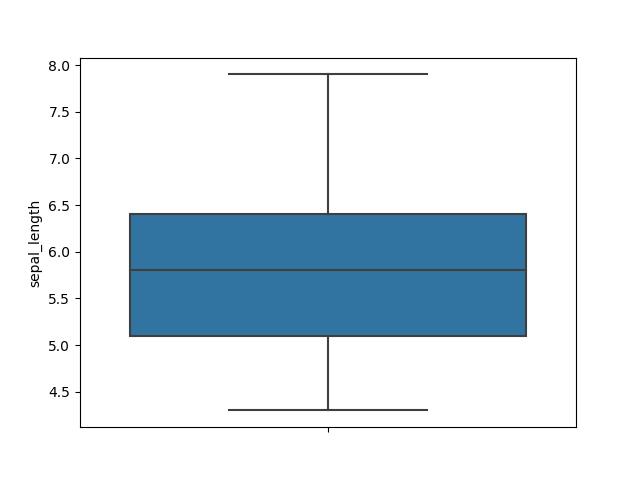
boxplot example
boxplot
The boxplot plot is reated with the boxplot() method. The example below loads the iris flower data set. Then the presented boxplot shows the minimum, maximum, 1st quartile and 3rd quartile.
import seaborn as sns
import matplotlib.pyplot as plt

df = sns.load_dataset('iris')
df.head()

sns.boxplot( y=df["sepal_length"] );
plt.show()
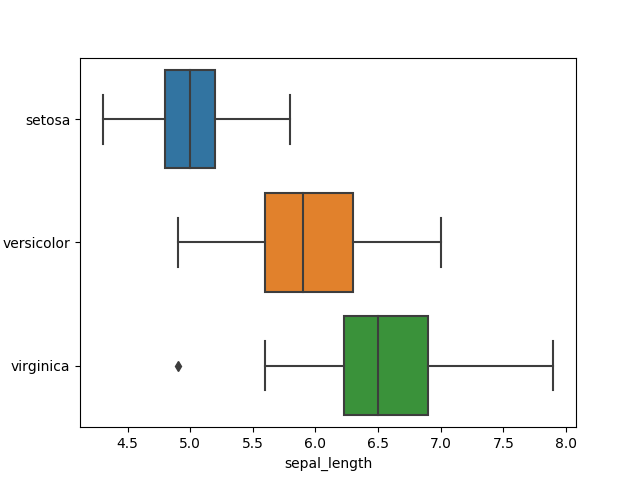
boxplot horizontal
The boxplot can be a horizontal plot. The example below shows the boxplot in horizontal direction. We use the iris dataset again. The colors shown are the default colors, but they are configureable.
import seaborn as sns
import matplotlib.pyplot as plt

df = sns.load_dataset('iris')
df.head()

sns.boxplot( y=df["species"], x=df["sepal_length"] );
plt.show()
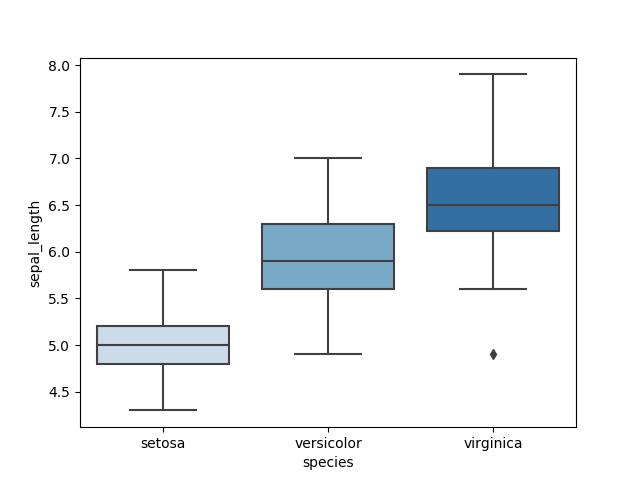
boxplot colors
The boxplot colors plot colors are configureable. You can do that by passing the palette parameters. There are all kinds of palettes, the palette 'blues' are all kinds of blue.
import seaborn as sns
import matplotlib.pyplot as plt

df = sns.load_dataset('iris')
df.head()

sns.boxplot( x=df["species"], y=df["sepal_length"], palette="Blues");
plt.show()
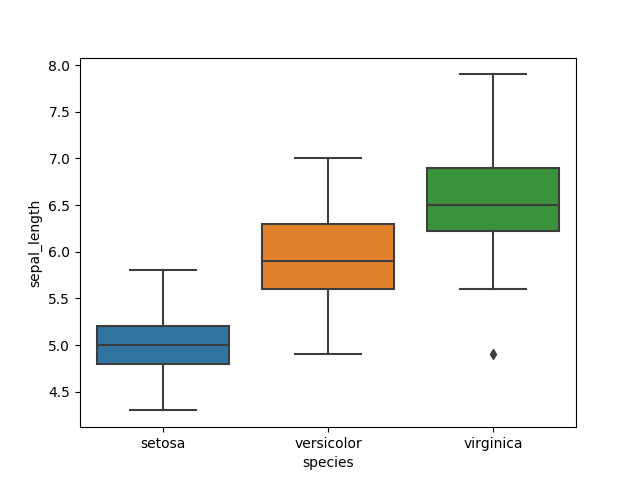
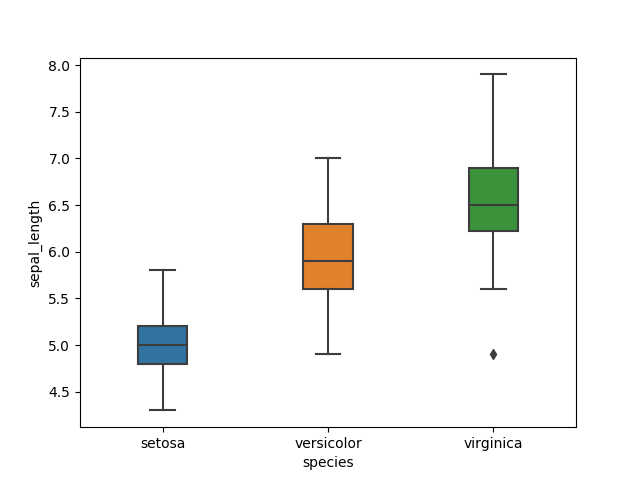
boxplot multiple
The boxplot multiple plot shows the sets in normal direction with the default colors.
import seaborn as sns
import matplotlib.pyplot as plt

df = sns.load_dataset('iris')
df.head()

sns.boxplot( x=df["species"], y=df["sepal_length"] );
plt.show()
boxplot size
The size of the individual boxplots can be altered wit hthe width parameter. The default width is 1, so anything less of that creates a smaller width for the boxes.
import seaborn as sns
import matplotlib.pyplot as plt

df = sns.load_dataset('iris')
df.head()

sns.boxplot( x=df["species"], y=df["sepal_length"], width=0.3);
plt.show()
Practice now: Test your Python skills with interactive challenges