Pandas is a data analysis and manipulation module that helps you load and parse data. That is a module you’ll probably use when creating plots.
In Pandas, data is stored in data frames. For instance, if you load data from Excel. Of course you don’t have to use Pandas when working with data, just as you don’t have to use a car when travelling. But it makes working with data much easier.
Related course: Matplotlib Examples and Video Course
example
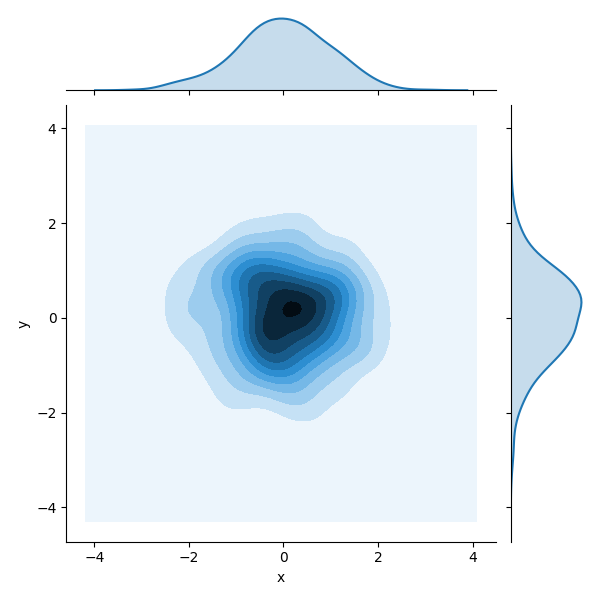
seaborn pandas
The seaborn pandas plot is created from the pandas dataframe. The data frame uses random data, but in practice this data often comes from databases, Excel or other sources.
The program creates different plots but for simplicity only one result is shown.
1 | import numpy as np |
If you are new to matplotlib, then I highly recommend this course.