Seaborn plots can use different palettes. These palettes decide upon the colors to use in the plots. It doesn’t matter which data set you use, for any dataset you can change the palette.
The palettes have different names like “hls”, “Blues” and so on. These are some of the color palette choices you have. Other palettes include “deep”, “vlag” and “rocket”.
Related course: Matplotlib Examples and Video Course
palette
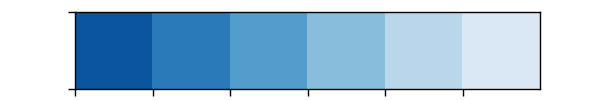
palette example
The example below shows the palette plot. The function palplot() creates a plot for the colors of the palette. It does that for different palettes. For simplicity, we only show one palette of all the palettes created.
1 | import numpy as np |
If you are new to matplotlib, then I highly recommend this course.