Seaborn plots can use different palettes. These palettes decide upon the colors to use in the plots. It doesn't matter which data set you use, for any dataset you can change the palette.
The palettes have different names like "hls", "Blues" and so on. These are some of the color palette choices you have. Other palettes include "deep", "vlag" and "rocket".
Practice now: Test your Python skills with interactive challenges
palette
palette example
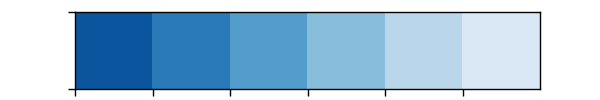
The example below shows the palette plot. The function palplot() creates a plot for the colors of the palette. It does that for different palettes. For simplicity, we only show one palette of all the palettes created.
import numpy as np
import pandas as pd
import matplotlib.pyplot as plt
import seaborn as sns

sns.set_context('paper')

# create plot
sns.palplot(sns.color_palette("hls", 8))
sns.palplot(sns.color_palette("Paired",10))
sns.palplot(sns.color_palette("Blues"))
sns.palplot(sns.color_palette("Blues_r"))
sns.palplot(sns.color_palette("BrBG", 7))
sns.palplot(sns.diverging_palette(10, 220, sep=90, n=7))
sns.palplot(sns.diverging_palette(255, 133, l=60, n=7, center="dark"))

plt.show()
Practice now: Test your Python skills with interactive challenges