Seaborn distplot lets you show a histogram with a line on it. This can be shown in all kinds of variations. We use seaborn in combination with matplotlib, the Python plotting module.
A distplot plots a univariate distribution of observations. The distplot() function combines the matplotlib hist function with the seaborn kdeplot() and rugplot() functions.
Practice now: Test your Python skills with interactive challenges
Example
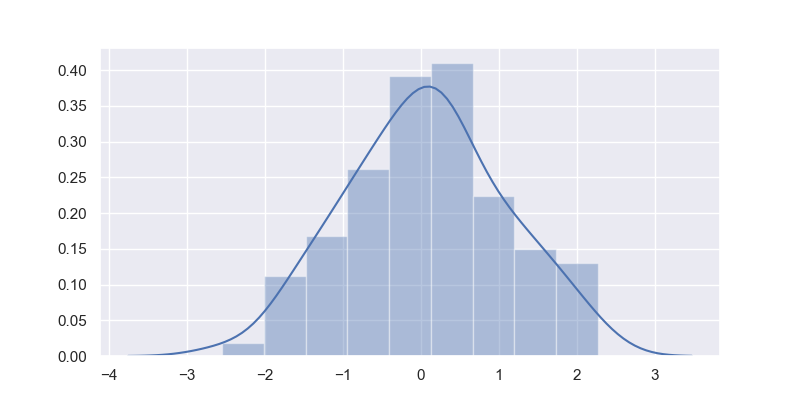
Distplot example
The plot below shows a simple distribution. It creats random values with random.randn(). This will work if you manually define values too.
import matplotlib.pyplot as plt
import seaborn as sns, numpy as np

sns.set(rc={"figure.figsize": (8, 4)}); np.random.seed(0)
x = np.random.randn(100)
ax = sns.distplot(x)
plt.show()
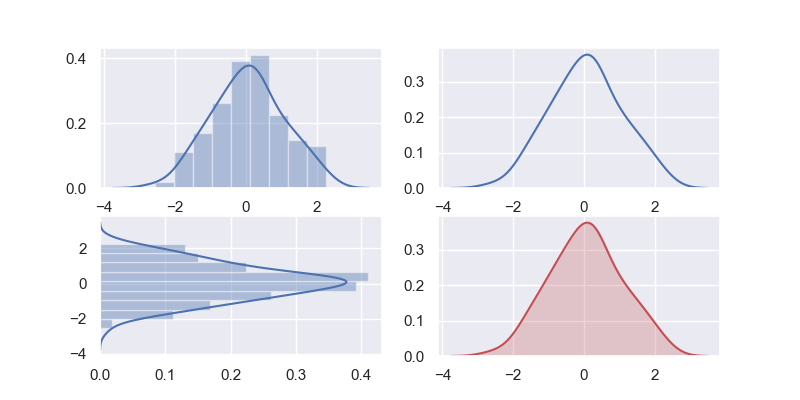
Distplot examples
You can show all kinds of variations of the distplot. We use the subplot() method from the pylab module to show 4 variations at once.
By changing the parameters in the distplot() method you can create totally different views. You can play around with these parameters to change color, orientation and more.
import matplotlib.pyplot as plt
import seaborn as sns, numpy as np
from pylab import *

sns.set(rc={"figure.figsize": (8, 4)}); np.random.seed(0)
x = np.random.randn(100)

subplot(2,2,1)
ax = sns.distplot(x)

subplot(2,2,2)
ax = sns.distplot(x, rug=False, hist=False)

subplot(2,2,3)
ax = sns.distplot(x, vertical=True)

subplot(2,2,4)
ax = sns.kdeplot(x, shade=True, color="r")

plt.show()
Python Data Visualization Bundle →
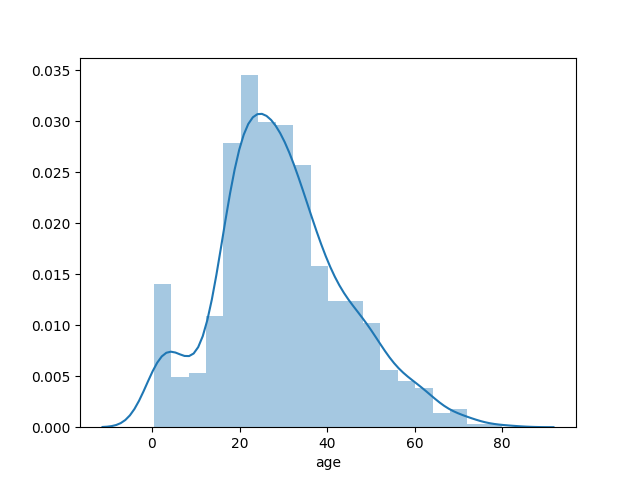
Seaborn dist
You an show a standard dataset from seaborn in histogram too. This is qutie a large dataset so only take one column.
import matplotlib.pyplot as plt
import seaborn as sns

titanic=sns.load_dataset('titanic')
age1=titanic['age'].dropna()
sns.distplot(age1)
plt.show()
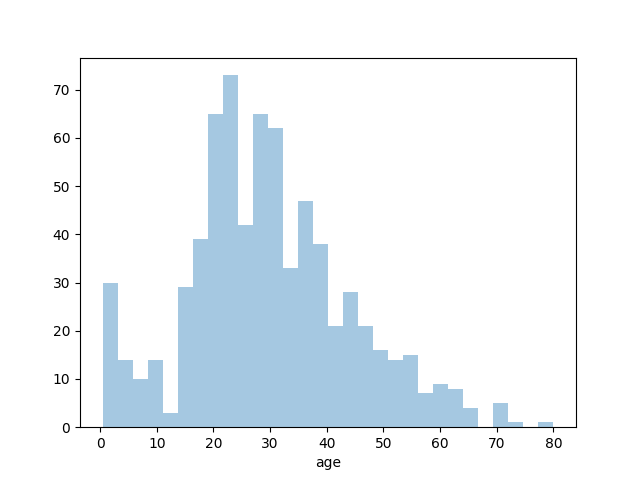
Distplot bins
If you want to change the number of bins or hide the line, that's possble too. When calling the method distplot9) you can pass the number of bins and tell the line (kde) to be invisible.
import matplotlib.pyplot as plt
import seaborn as sns

titanic=sns.load_dataset('titanic')
age1=titanic['age'].dropna()
sns.distplot(age1,bins=30,kde=False)
plt.show()
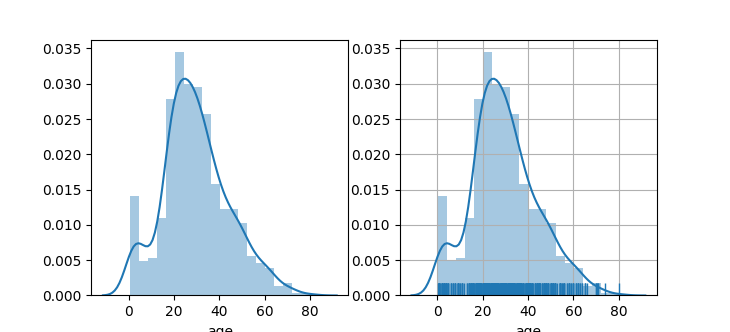
Seaborn different plots
The example below shows some other distribution plots examples. You an activate a grid with the grid(True) method call.
import matplotlib.pyplot as plt
import seaborn as sns

titanic=sns.load_dataset('titanic')
age1=titanic['age'].dropna()

fig,axes=plt.subplots(1,2)
sns.distplot(age1,ax=axes[0])
plt.grid(True)
sns.distplot(age1,rug=True,ax=axes[1])
plt.show()
Practice now: Test your Python skills with interactive challenges