Polynomial regression can be very useful. There isn't always a linear relationship between X and Y. Sometime the relation is exponential or Nth order.
Practice now: Test your Python skills with interactive challenges
Regression
Polynomial regression
You can plot a polynomial relationship between X and Y. If there isn't a linear relationship, you may need a polynomial. Unlike a linear relationship, a polynomial can fit the data better.
You create this polynomial line with just one line of code.
poly_fit = np.poly1d(np.polyfit(X,Y, 2))
That would train the algorithm and use a 2nd degree polynomial. After training, you can predict a value by calling polyfit, with a new example. It will then output a continous value.
Example
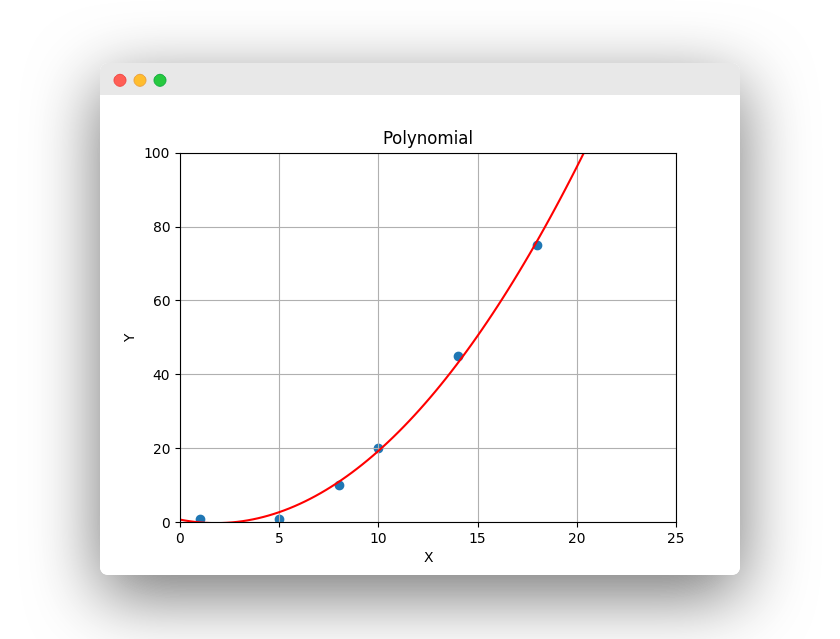
The example below plots a polynomial line on top of the collected data. It trains the algorithm, then it makes a prediction of a continous value.
import numpy as np
import matplotlib.pyplot as plt

X = [1, 5, 8, 10, 14, 18]
Y = [1, 1, 10, 20, 45, 75]

# Train Algorithm (Polynomial)
degree = 2
poly_fit = np.poly1d(np.polyfit(X,Y, degree))

# Plot data
xx = np.linspace(0, 26, 100)
plt.plot(xx, poly_fit(xx), c='r',linestyle='-')
plt.title('Polynomial')
plt.xlabel('X')
plt.ylabel('Y')
plt.axis([0, 25, 0, 100])
plt.grid(True)
plt.scatter(X, Y)
plt.show()

# Predict price
print( poly_fit(12) )
Overfitting and underfitting
It's important to not overfit or underfit, you want to capture the relationship but not follow the points exactly. A linear relationship would underfit, overfitting would be picking the degree so high that it fits the points. Instead, you want to capture the relationship.
Practice now: Test your Python skills with interactive challenges