Plotly is a charting module for Python. It can create publication-quality charts. It supports many types of charts/plots including line charts, bar charts, bubble charts and many more.
The library is free and open source. In this tutorial you'll learn how to create a line chart with plot.ly. It can be seen as more expansive alternative to matplotlib.
Practice now: Test your Python skills with interactive challenges
Example
introduction
Install plotly from the PyPi repository. In a new virtual environment install plotly, you can use the program pip for that.
pip install plotly
Plotly provides a webservice for plotting charts. Graphs are saved inside your online Plotly account. This is optional, Plotly can be used offline.
Offline plotting has two options:
-
Use plotly.offline.plot() to create and standalone HTML. This file can be opened in your browser
-
Use plotly.offline.iplot() when working offline in a Jupyter Notebook.
online plot
Online plots require an acount on plot.ly
Change to your username and API key
Open the file ~/.plotly/.credentials and update your API key.
Then create this program:
import plotly.plotly as py
import plotly.graph_objs as go
import numpy as np

py.sign_in(username='voorbeeld', api_key='L0McCrDpID71OLCEgRtK')

mx = [1, 2, 3, 4]
my = [1, 2, 3, 4]

trace = go.Scatter(
    x = mx,
        y = my
    )

data = [trace]
py.plot(data)
Run the program from the terminal. Then open the url https://plot.ly/organize/home/#/ where your chart will show up.
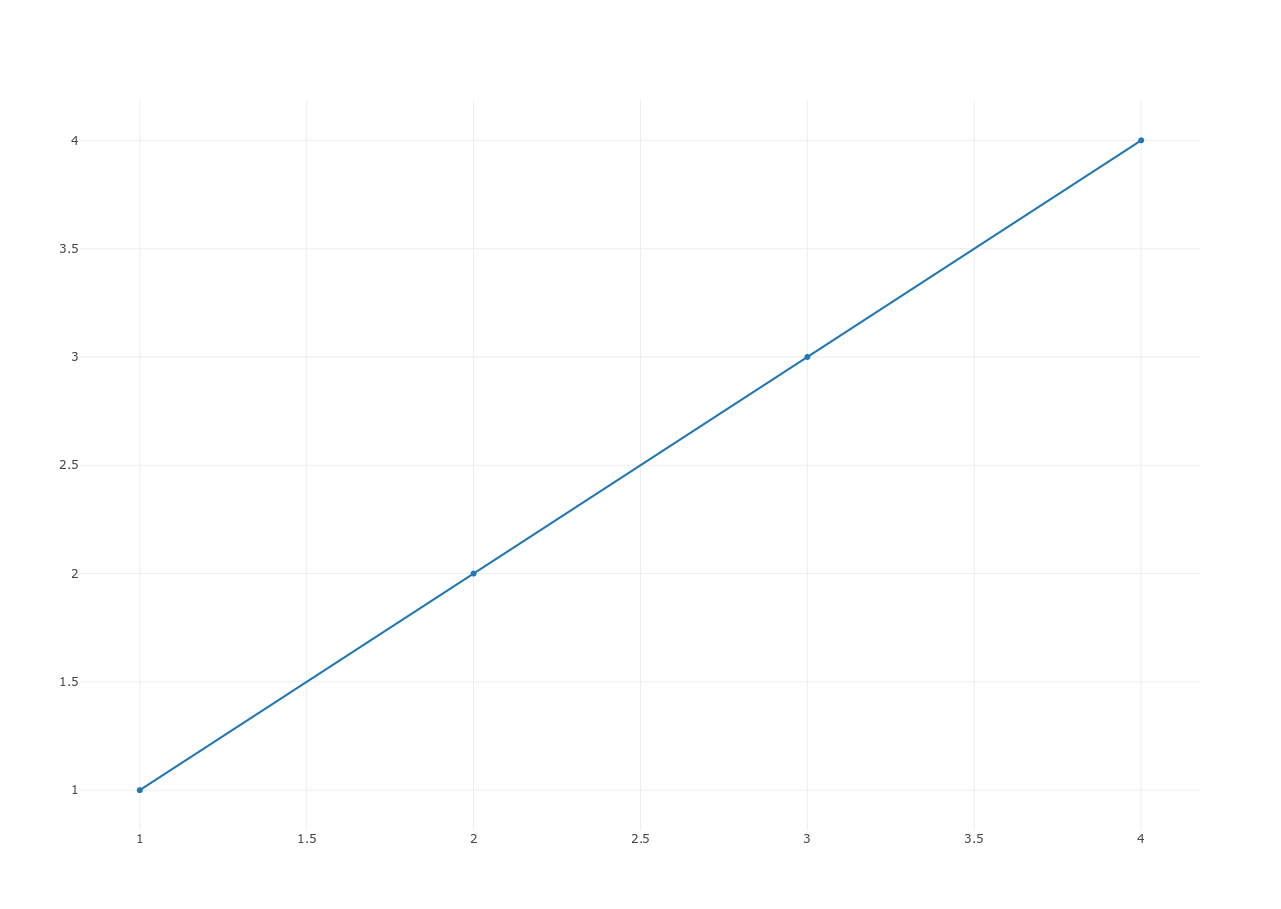
standalone HTML (plotly.offline.plot)
The code below creates a new HTML file. This HTML file when opened with a browser (Firefox, Chrome) will show the chart.
import plotly
import plotly.graph_objs as go

plotly.offline.plot({
    "data": [go.Scatter(x=[1, 2, 3, 4], y=[1, 2, 3, 4])],
        "layout": go.Layout(title="line chart")
    }, auto_open=True)
iPython jupyter notebook
An alternative method is to use jupyter notebook (ipython). ipython is a powerful interactive shell.
You can install it with the command
python3 -m pip install jupyter
jupyter notebook
This will start a web server. Click new -> notebook -> python3 from the /tree page.
In the code box paste the code below:
import plotly
import plotly.graph_objs as go

plotly.offline.init_notebook_mode(connected=True)

plotly.offline.iplot({
    "data": [go.Scatter(x=[1, 2, 3, 4], y=[4, 3, 2, 1])],
        "layout": go.Layout(title="hello world")
    })
Then click on run, the chart will show below the code.
Practice now: Test your Python skills with interactive challenges